What 1,011 Buyers and Employees Told Us About Employee Gifting in 2026
 Posted By Custom Ink Staff —
The Custom Ink Staff is a team of design enthusiasts and promo product experts dedicated to bringing your ideas to life. From screen printing secrets to the latest trends in custom gear, we draw on decades of collective experience to help you create something unforgettable.
SHARE:


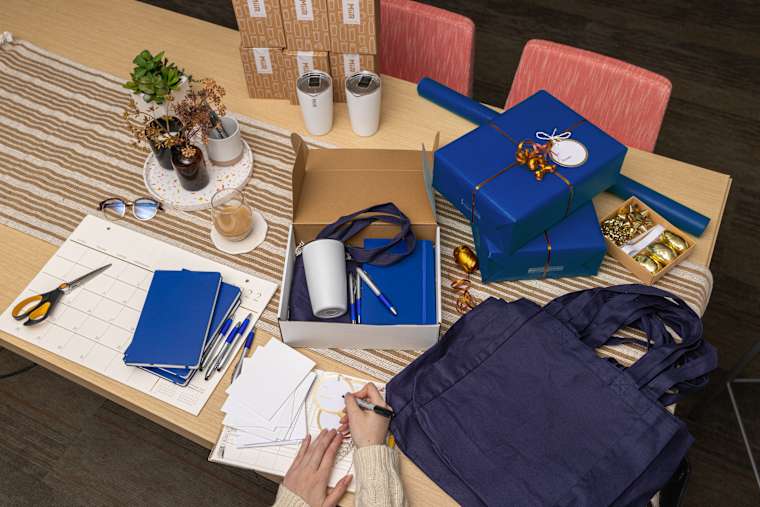
Odds are, the person choosing your company’s holiday gifts for employees doesn’t work in HR. They run operations, process invoices, or manage client accounts, and gift duty landed on them anyway. We affectionately call them the office octopus. They have eight arms to juggle everything gifting season throws at them, and three hearts because they care that much about getting appreciation right (fun fact: octopuses really do have three hearts!).
To make their jobs easier, our 2026 Holiday Gift Survey asked 509 gift buyers (fellow office octopi) and 502 employees what works and what flops.
While people often say “it’s the thought that counts” to excuse a missed mark, our data shows the thought is exactly what makes a gift last. Employees keep gifts that are useful, well-made, and personal, and they feel a better connection to the companies that give them.
In This Article
- The Anatomy of a Winning Employee Holiday Gift
- What Holiday Gifts for Employees Actually Get Used?
- Is Skipping a Holiday Gift Worse Than Giving a Bad One?
- The Thoughtfulness Gap
- Who Picks the Holiday Gifts for Employees?
- When Should You Order Employee Gifts, and What Should You Spend?
- What to Do If You’re Buying Employee Gifts Right Now
- Appendix: Full Survey Data
- Frequently Asked Questions
Key Takeaways
- 94% of employees value a gift more when it feels personal. For 38%, that means thought and effort went into it versus having your name printed on it (12%).
- The Thoughtfulness Gap: While 93% of gift buyers feel confident in their choices, only 35% make decisions based on actual employee insight. Fewer than 4 in 10 employer gifts are still in regular use.
- 98% of employees say a gift they love makes them feel better about their employer. And 97% say it makes them more likely to stay.
The Anatomy of a Winning Employee Holiday Gift

If you want your holiday gifts to make an impact this season, skip the generic catalog defaults. Employees want three simple things from corporate gifts: genuine intention, name brands they trust, and items that don’t feature prominent company logos.
It’s the Thought That Lasts
Nearly every employee (94%) values a gift more when it feels personal. In fact, 64% value it significantly more. That makes personalization the closest thing to a guaranteed win in holiday gifting.
But here’s the catch: Personal means more than a monogram. When we asked employees what actually creates that personal feel, actual time, thought and effort won by a landslide at 38%. A name, initials, or engraving came in at 12%. Fitting their interests (11%) and feeling made just for them (11%) followed.
One employee wrote, “It feels thoughtful, like they didn’t just find something that was popular but looked for something tailored to me.”
Another summed up their worst gift in four words: “An impersonal gift card.”
When Employees Feel Seen, They Stay

When you get personalization right, loyalty follows. Employees who place high value on personal gifts are nearly three times more likely to say they would stay with their company when they receive something they love (61% vs. 23%). They’re also twice as likely to view their employer in a drastically more positive light (73% vs. 37%).
Intentionality isn’t luck; it’s thoughtful product selection. Pick a core item that fits your team’s personality and lifestyle, then add meaningful customization. Make the design about them: the nickname your project team gave itself, the inside joke from the Q3 offsite, or the milestone you hit together this year. With hundreds of fonts and clip art in every style in the Design Lab, you can have the gift truly embody the spirit of your team.
Brands They Know. Logos They Barely Notice
A premium brand name instantly elevates a gift’s value for 95% of employees. So what’s at the top of everyone’s holiday list this year? These are the top 10 brands chosen by our respondents for 2026.
| Brands employees want | Share of employees |
|---|---|
| Nike | 51% |
| The North Face | 44% |
| Sony | 42% |
| Adidas | 41% |
| Yeti | 39% |
| Bose | 39% |
| Stanley | 38% |
| Under Armour | 37% |
| JBL | 33% |
| Carhartt | 31% |
Our featured brands include all of the above, from Nike and The North Face to Yeti, Stanley, and JBL.
As for company logos, keep them small and tasteful: 42% of employees prefer low-key, subtle placement while 17% desire a large logo. 41% said they do not care either way.
Embroidery gives you a small, clean logo on jackets, fleece, and hats.
One Hero Gift. Plus, Why Choice Always Wins
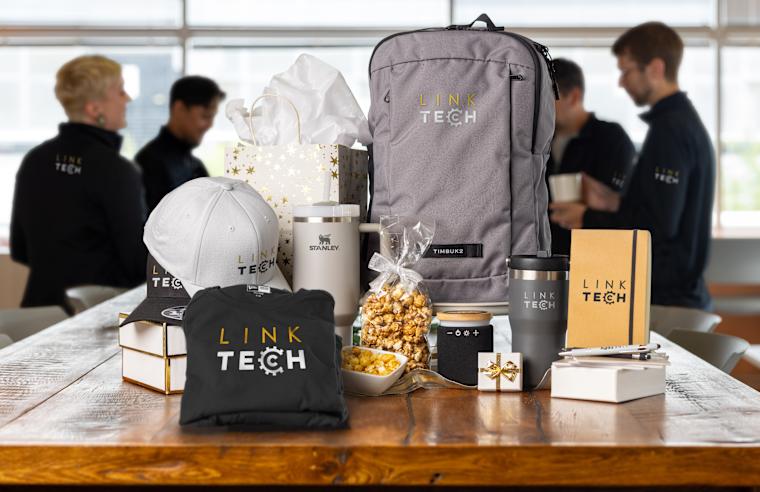
If you’re still handing out identical gift baskets to every person in the office, half your team is quietly calculating how to regift their loot.
Our survey data shows a clear divide in how companies distribute holiday gifts and how employees want to receive them.
Give options, not directives: Just over half of companies (53%) let employees choose from a few options, while 47% give everyone the same gift.
The verdict from employees we surveyed? Choice rules.
- 58% of employees want to pick their gift from a curated list
- 23% of employees prefer everyone receiving the same item
Setting up a pop-up Online Store lets you curate a tight, high-quality collection so your team gets the exact item, style, or size they want, while you keep control over the budget and overall brand look.
Go big on one gift: When allocating your holiday budget per person, resist the urge to buy a bunch of small trinkets to fill out a package. Focus the entire spend on one higher-tier item.
Sixty-eight percent (68%) of gift buyers believe one premium gift has more impact than several cheaper ones, and employees tend to agree.
- 55% of employees prefer one premium item
- 22% prefer several cheaper items
- 23% say they have no preference
What Gen Z Employees Want vs. Senior Employees
If you want to win over your youngest team members, a pen set isn’t going to cut it. Gen Z treats employee gifting as a direct reflection of company culture. And they hold the highest bar for getting it right.
A solid 61% of Gen Z employees say receiving a gift they love makes them much more likely to stay with their employer, and 75% value a gift more when it feels personal.
When it comes to what actually lands with this group, brand name and utility are everything:
- The water bottle battle: Stanley remains the runaway favorite, pulling 45% of Gen Z interest. Owala comes in strong at 23%, compared to just 4% of employees aged 65 and up, who remain largely indifferent to the internet’s favorite hydration gear.
- The gift card shift: While gift cards are a top-three favorite for 64% of workers 65 and older, that number drops to 45% for 18-to-24-year-olds. Gen Z would rather receive a tangible, high-quality product they’ll use every day than an email with a redemption code.
The takeaway? If you want to boost retention with your rising talent, skip the safe defaults and invest in the premium gear they’re already adding to their personal wishlists.
What Holiday Gifts for Employees Actually Get Used?
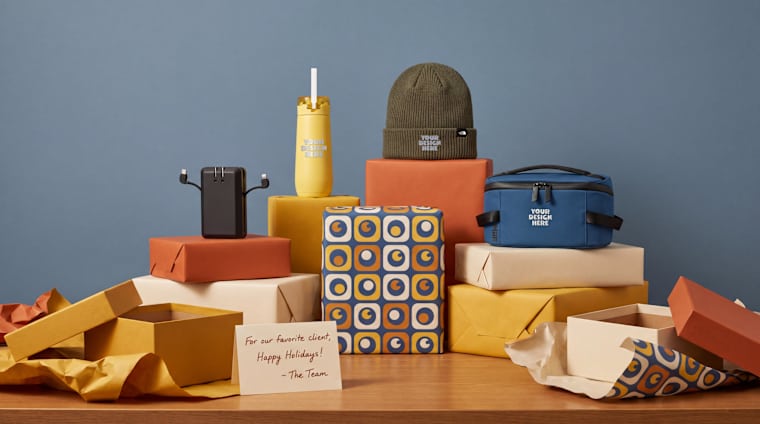
Here is a sobering stat for anyone holding a gifting budget: only 40% of the gifts employees received most recently are actually in regular use.
The rest? 31% are sitting unused, 15% were re-gifted or donated, and 8% went into the trash. The remaining 6% can’t even remember.
If you want your gift to end up in the 40% win column instead of the landfill, the category you choose can make a difference. Here’s what we found out when we asked employees what they did with gifts from ten top gift categories.
| Gift category | Used regularly | Companies that bought it | Employees: top-3 favorite | Employees: top-3 least favorite | Net score |
|---|---|---|---|---|---|
| Gift cards | n/a | 63% | 55% | 12% | +43 |
| Tech / electronics | 53% | 30% | 38% | 11% | +27 |
| Apparel | 43% | 48% | 31% | 12% | +19 |
| Outerwear | 43% | 28% | 24% | 10% | +14 |
| Food & drink | n/a | 52% | 30% | 16% | +14 |
| Drinkware | 44% | 45% | 18% | 20% | −2 |
| Bags | 38% | 36% | 17% | 18% | −1 |
| Office products | 32% | 31% | 5% | 51% | −46 |
| Stationery | 30% | 28% | 8% | 43% | −35 |
| Plants or greenery | 35% | 18% | 9% | 37% | −27 |
Gifting do: Tech holds the crown for utility. Over half of employees (53%) use tech gifts on a regular basis, and 51% singled out electronics as the category that feels freshest and most exciting. The disconnect? Only 30% of companies have gifted tech, and 39% of employees have never received it from an employer.
Gifting don’t: Office products sit at the other end, and employees like them even less than last year. Half of employees (51%) now rank them among their top three least favorite, a sharp climb from 38% in our 2025 survey. That moves office products past stationery into last place. Yet nearly a third of companies (31%) still buy them, and only 5% of employees rank them a top-three favorite.
Last year we suggested a few swaps for the least-liked gifts. They still hold up, and this year’s data shows which replacements employees actually keep.
Smart Gift Swaps: What to Ditch & What to Give Instead
| Skip this | Least favorite (2025 / 2026) | Give this instead | Why it works in 2026 |
|---|---|---|---|
| Office products | 38% / 51% | Apparel, like hoodies and hats | 43% wear it regularly, net score +19 |
| Stationery | 39% / 43% | Tech, like chargers and earbuds | Highest regular use at 53%, net score +27 |
| Plants | 35% / 37% | Outerwear, like jackets and fleece | Least-disliked category both years, net score +14 |
Why Apparel Works and Drinkware Divides
Apparel and outerwear consistently land in the win column, with 43% of recipients wearing their gear regularly. High-end hoodies, structured hats, technical fleece, and versatile vests give employees something functional that fits naturally into their off-duty lives.
Drinkware, on the other hand, is a double-edged sword. While 44% of employees use their mugs and tumblers daily, 20% still rank the category among their absolute least favorites — usually because their kitchen cabinets are already overflowing.
If you go the drinkware route, stick strictly to heavy-hitting brands: YETI drew the most interest at 39%, then Stanley at 38%. Both appear in our custom tumblers lineup.
How to Give a Gift That Lasts
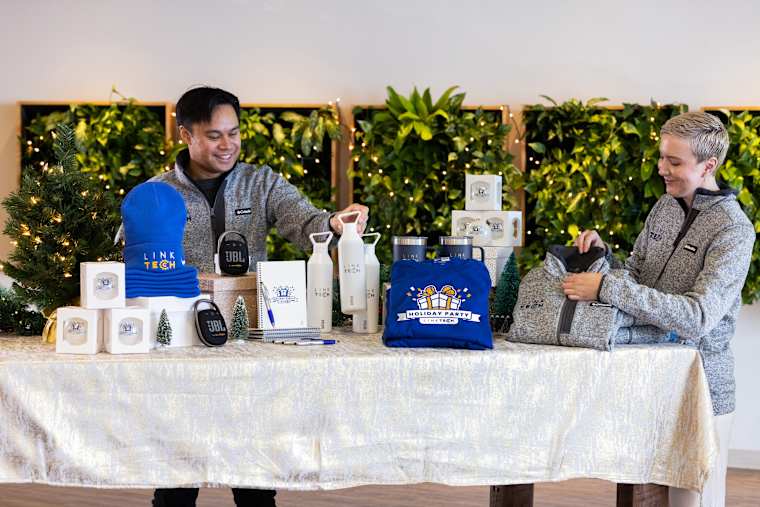
The true test of any employee holiday gift is whether it survives the post-holiday purge and earns a permanent spot in daily life. When we surveyed 502 U.S. employees across major corporate hubs, their feedback on what makes a gift last was clear:
- Daily utility (51%): It solves a real problem, fits seamlessly into a remote or hybrid work routine, or upgrades their daily commute.
- Build quality & durability (43%): Premium materials and high-grade craftsmanship ensure the product holds up through repeated washings and daily use.
- Personal style & subtle branding (35%): It features a modern cut, neutral tones, or a low-profile logo that looks great anywhere — from office headquarters in Chicago to weekend outings in Austin.
- Personal meaning (27%): It reflects genuine thought, team recognition, or a shared milestone rather than a last-minute bulk order.
Utility, craftsmanship, and personal connection form the three hearts of a gift that lands.
Currently, only 35% of employees say their employer gifts have been both cool and useful. Another 38% call past gifts useful but not exciting. The rest call them cool but unused (21%) or unmemorable (7%).
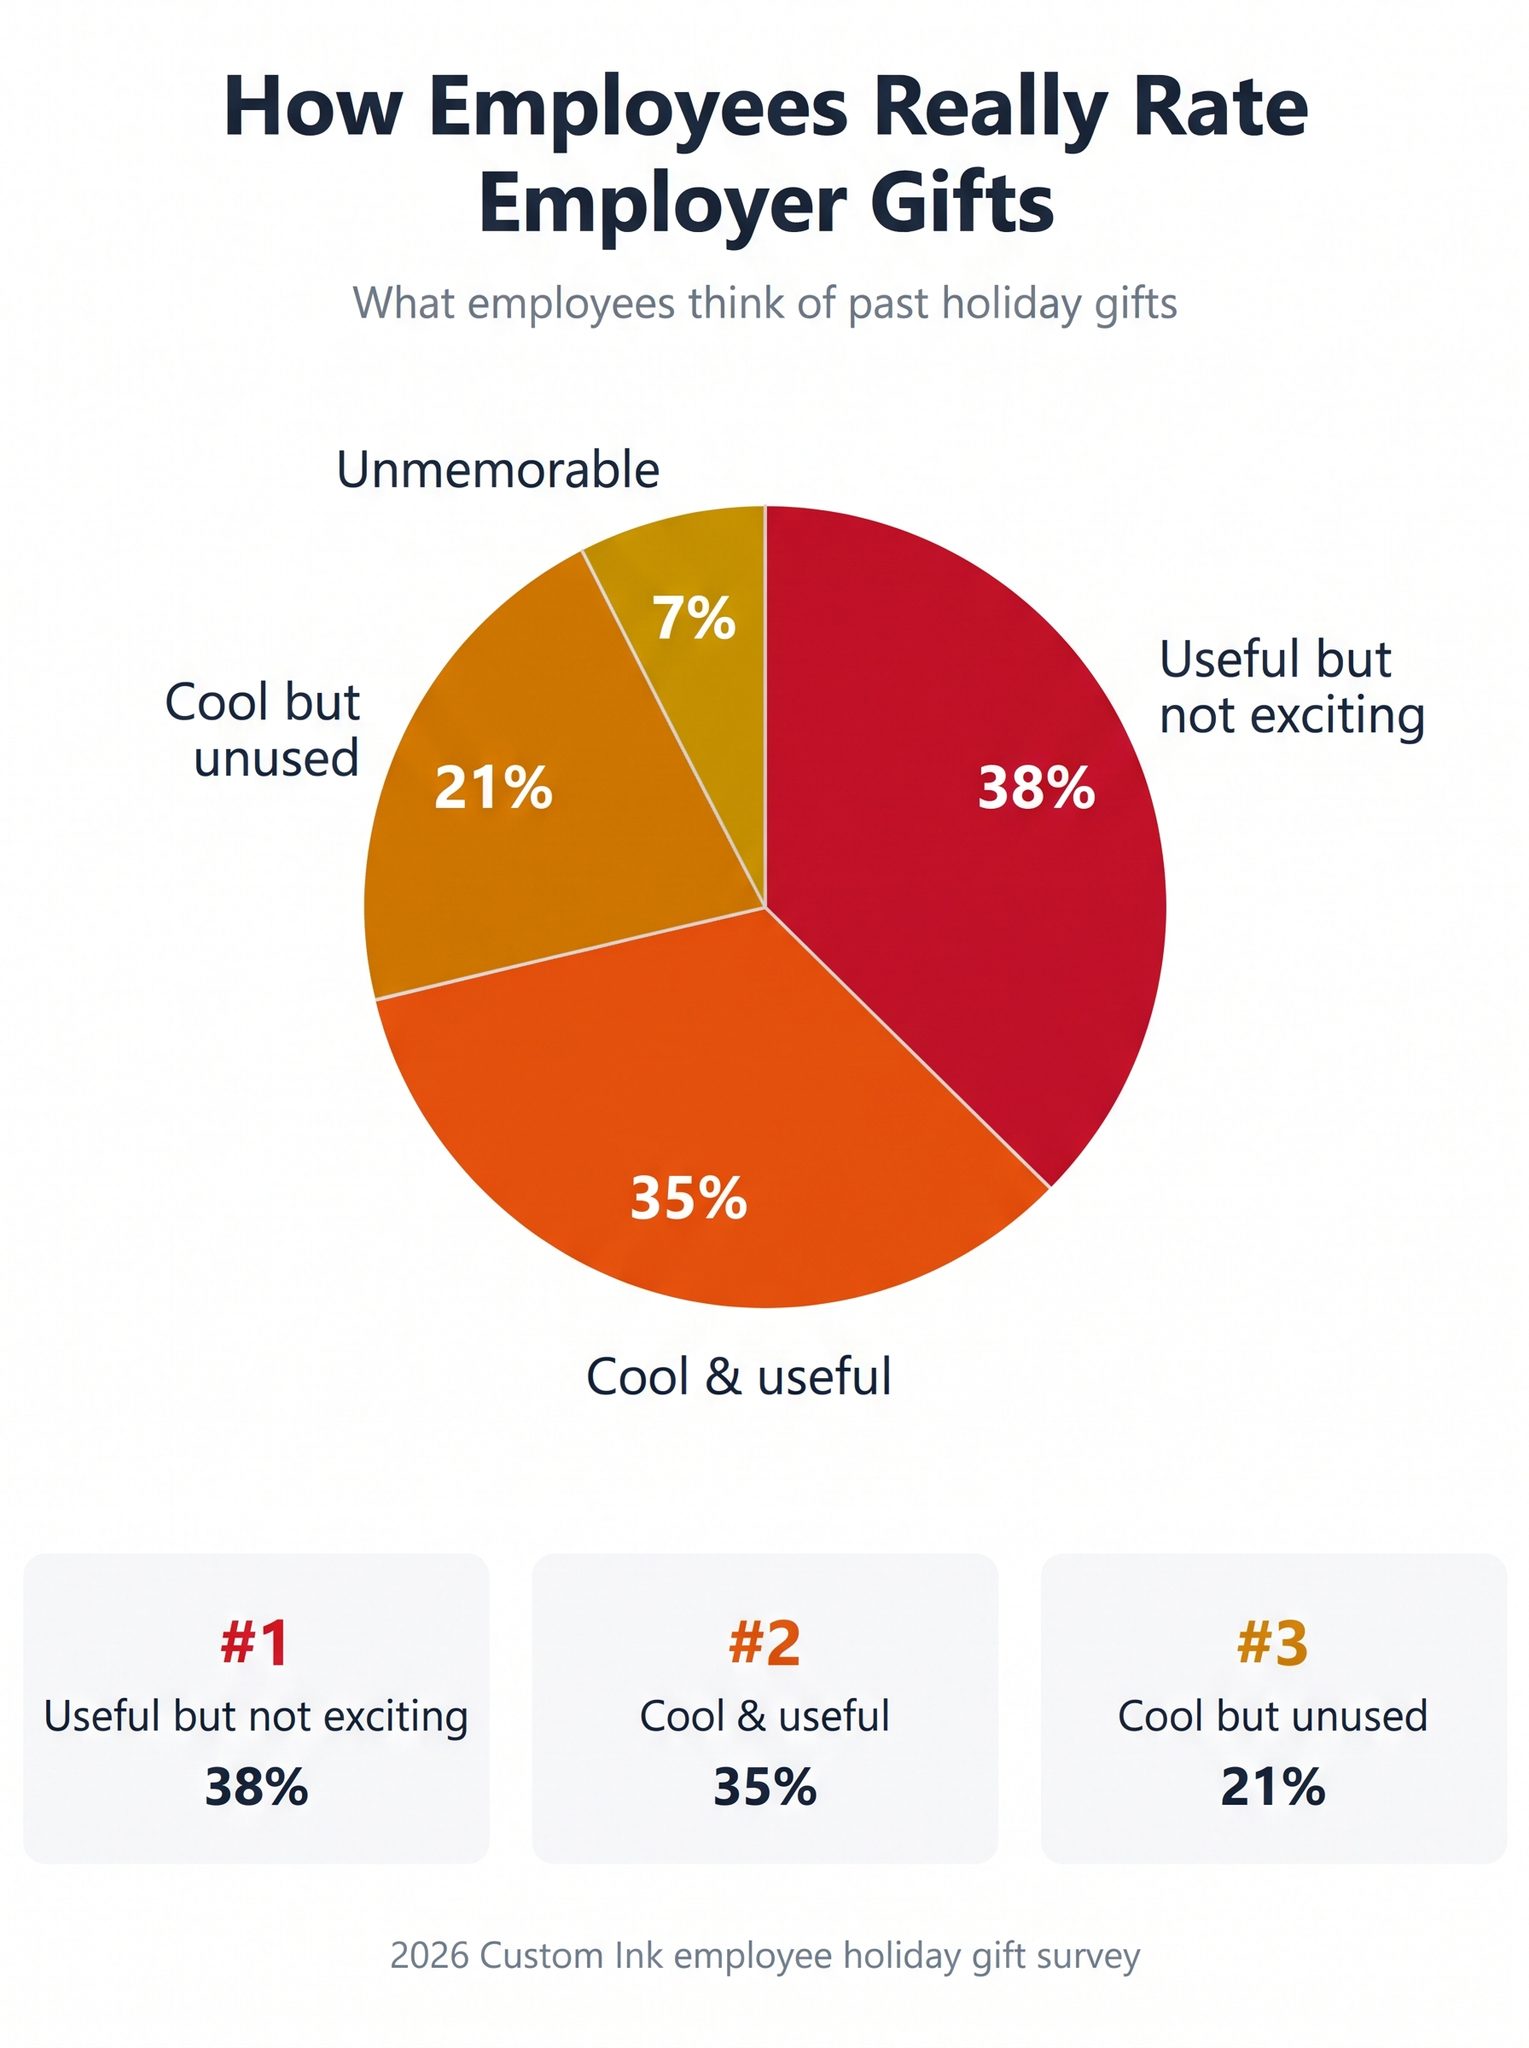
By prioritizing useful, high-grade custom products from top brands, companies can eliminate wasted budget, boost team retention, and deliver holiday gifts that staff across the country will actually keep and use for years.
Is Skipping a Holiday Gift Worse Than Giving a Bad One?
Short answer: Absolutely.
If you think skipping gifting season altogether is safer than risking a flop, the numbers tell a different story. When we asked employees to name the absolute worst holiday gift they’ve ever received from a boss, the top answer wasn’t fruitcake or a branded lanyard.
It was getting nothing.
| Worst gift received from an employer | Share of answers |
|---|---|
| Nothing, no gift at all | 23% |
| Cheap, generic, or branded items | 22% |
| Food, candy, or fruitcake | 12% |
| Socks or other clothing | 10% |
| Gift cards or token cash | 8% |
| Just a card, a thank-you, or a hug | 6% |
Employee Holiday Gift Horror Stories
We asked employees about their worst work gifts, and they had stories. Some gifts never arrived. Others, unfortunately, did.
The ones that never arrived:
- “Getting nothing and no appreciation.”
- “A stocking with nothing in it.”
- “The worst gift was nothing after years of receiving an annual gift.”
The ones that, unfortunately, did:
- “A $5 gift card to Dunkin Donuts.”
- “A company coffee cup filled with outdated coffee packs.”
- “Pen that did not work.”
- “The worst was a book on how to be better at my job.”
Who’s getting scrooged: Getting passed over leaves a lasting mark. Roughly one in five employees (22%) received no gift from their employer last holiday season. Among that group, 34% name getting nothing as their worst gift.
Who’s doing the scrooging: Surprisingly, large employers skip the holiday gifts most often. At companies with 1,000 or more employees, 32% of employees got no gift last season. At companies with 50 to 249 employees, it was 16% (126 and 159 respondents).
A Standout Gift Make Employees Stick Around

Employees connect a good gift to how they feel about work. Nearly all of them (98%) say a gift they love makes them feel more positive about their employer, and 60% say much more positive. Meanwhile, 97% say it boosts their likelihood of sticking around, with 48% saying they’re much more likely. Employees who got a gift last season were more likely to say “much more likely to stay,” at 52% versus 31% for those who did not.
However, buyers rarely frame their gifts that way. Showing appreciation is the top primary goal for employee gifts at 42%. Only 8% name supporting retention. For most companies, the holiday gift is already doing retention work nobody planned for.
What Employees Call Their “Best Gift Ever”
Winning gifting season doesn’t require overcomplicating things. When asking workers about their all-time favorite gifts, two clear patterns emerge:
Gift cards (30%) and cash or bonuses (28%) make up 57% of best-gift answers. Gift cards are also the top favorite category at 55%, the same as in our 2025 Employee Holiday Gift Survey. Token amounts backfire, though. Small gift cards and tiny cash gifts make up 8% of the worst-gift answers.
Among physical gifts, technology leads at 11%, followed by everyday home items at 10%.
What Is the Thoughtfulness Gap in Employee Holiday Gifts?

The Thoughtfulness Gap is the distance between how confident gift buyers feel and how much they know about what employees want. Nearly all buyers (93%) say they are very or somewhat confident their gifts feel meaningful. Yet only 35% say they choose gifts with real insight into what recipients want.
| How buyers decide what to give | Share of buyers |
|---|---|
| We have real insight into what recipients want or would value | 35% |
| Someone on the team makes a personal judgment call | 22% |
| We mostly go with what’s within budget and hope it lands well | 20% |
| We follow what we did last year without much reconsideration | 13% |
| We rely on a vendor’s recommendation | 9% |
| Other | 1% |
Surprisingly, more guesswork does not lower one’s gift-giving confidence. Among the 171 buyers who budget and hope for the best or repeat last year’s list, 92% still feel sure of their choices.
Few buyers check their work, either. Among the 407 who buy employee gifts, a quarter (25%) do not measure success at all. The most common measure is employee feedback or thank-you notes, at 51%. Even among buyers who don’t measure, 90% still say they are confident.
Of course, gift managers aren’t trying to fail. They just need better tools. When we asked buyers what would actually make their lives easier, their top requests were simple:
- A wider range of high-quality items within budget (39%)
- Direct feedback from past recipients (38%)
- Personalization without added costs or logistical headaches (35%)
The good news? You don’t need a massive consulting firm to get that feedback. Employees are more than willing to tell you what they want — and they already have. You just have to look at the data before you place your order.
Who Picks the Holiday Gifts for Employees at Your Company?
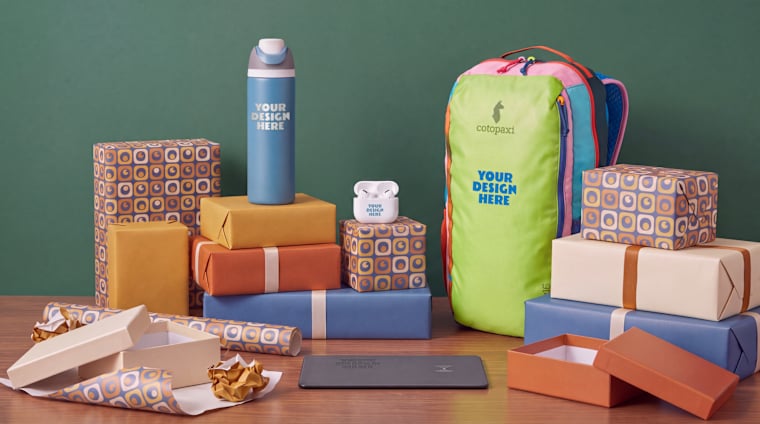
If you assume the People Team spends Q4 carefully curating employee presents, think again. The vast majority of holiday gifts are chosen, ordered, and tracked down by people who have an entirely different full-time job.
In our survey, 83% of gift deciders work outside HR. Most often, gift duty lands on the desk of an ops lead, an administrative coordinator, or an executive assistant who suddenly finds themselves managing a multi-thousand-dollar project on top of their normal workload.
| Role of gift decider | Share of buyers |
|---|---|
| Operations, administration, or procurement | 34% |
| Human resources or people operations | 17% |
| Sales, client success, or business development | 16% |
| Executive leadership | 12% |
| Finance or accounting | 8% |
| Marketing, brand, or communications | 4% |
| Other | 9% |
Selecting holiday gifts is rarely one job. In the past year, 80% of buyers helped choose employee gifts, and 57% helped choose client gifts. More than a third (37%) carried the burden of running both lists simultaneously. If you also buy for customers, our custom client gifts page covers that side.
When it comes to sourcing holiday gifts, companies take very different paths:
- 35% juggle multiple vendors at once
- 27% handle all the sourcing, packing, and fulfillment entirely in-house
- 20% streamline the process through a dedicated online gifting platform
- 18% rely on a single primary vendor
This extra workload is a familiar story to us. In our 2026 Swag Organizer Survey, 60% of organizers said swag duties sit outside their official job description or evolved informally. The people behind the gifts do real work, and most of it goes unseen.
The 8 Arms of the Office Octopus: What Gift Buyers Juggle

Managing corporate gift duty isn’t just a logistics task; it’s a cognitive high-wire act. Holiday gift buyers must actively balance eight competing demands at once, where over-indexing on one challenge means dropping another. We asked buyers about their biggest challenges when choosing holiday gifts. Each could pick up to two. The answers read like an octopus’s eight-armed balancing act.
| Arm | Challenge | Share of buyers |
|---|---|---|
| 1 | Staying within budget | 40% |
| 2 | Finding something that appeals to everyone | 40% |
| 3 | Choosing gifts that feel personal or meaningful | 31% |
| 4 | Making sure gifts are high-quality or useful | 26% |
| 5 | Managing time to plan and purchase early enough | 15% |
| 6 | Coordinating logistics such as ordering, shipping, and distribution | 14% |
| 7 | Getting leadership or stakeholder approval | 12% |
| 8 | Finding eco-friendly or sustainable options | 10% |
When Should You Order Employee Gifts, and What Should You Spend?

If you want to avoid paying rush-shipping fees or hand-delivering packages in a panic before holiday break, timing is everything.
Order by mid-November, and your gifts arrive in early December, right when employees want them. Most employees (81%) hope to unwrap their gift between early December and the holiday break. Early December is the favorite at 31%. Only 1% are holding out for a January surprise.
Our free standard shipping takes about two weeks, and rush options are there if the calendar gets away from you.
| Preferred timing (employees) | Share | When buyers start planning | Share |
|---|---|---|---|
| Early November | 5% | Before September | 11% |
| Mid-to-late November | 9% | September | 17% |
| Early December | 31% | October | 32% |
| Mid-December | 26% | November | 27% |
| Right before the holiday break | 24% | December | 11% |
| Timing doesn’t matter | 4% | Last-minute, no advance plan | 2% |
| After the new year | 1% |
Most buyers (59%) start planning in October or November, which leaves plenty of breathing room. The 11% who start in December are cutting it close. The 2% with no plan at all are braver than most of us.
Remote and hybrid teams add one more step. Choose ship-to-multiple-addresses at checkout, and each gift lands on the employee’s doorstep instead of an empty office desk.
The Budget Sweet Spot: What Companies Actually Spend
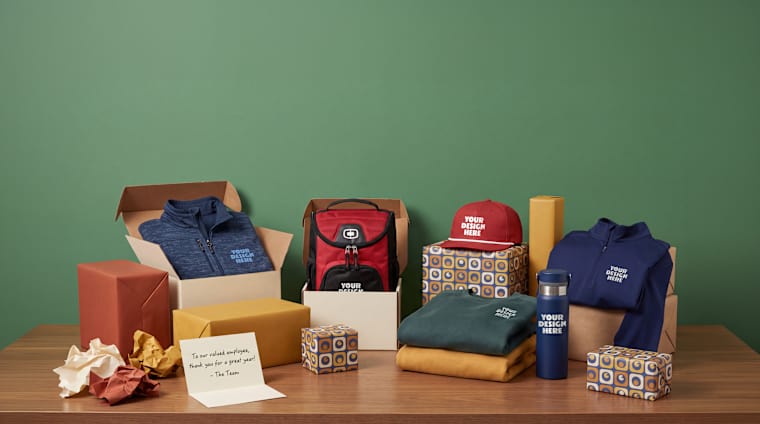
When it comes to per-person spend, budgets cluster in the middle. Among buyers, 43% spend $25 to $49 per employee, and 31% spend $50 to $99. Client gift budgets look nearly identical. That matters if your client gifts and employee gifts share one budget line (and one very busy octopus).
Whatever your budget number is, remember the gold standard: spend it all on one standout item rather than splitting it across two cheaper trinkets. Quality always wins the day.
| Typical budget per gift | Employee gifts | Client gifts |
|---|---|---|
| Under $25 | 14% | 15% |
| $25 to $49 | 43% | 43% |
| $50 to $99 | 31% | 31% |
| $100 or more | 13% | 11% |
What to Do If You’re Buying Employee Gifts Right Now
- Don’t skip the gift. Getting nothing was the top worst-gift answer, at 23%.
- Make it personal. Nearly every employee (94%) values a personal gift more. Pick a gift that fits the team, then add each name with our names and numbers feature.
- Upgrade one item, ideally from a brand they know. Most employees (55%) prefer one premium item over several cheaper ones, and 95% value a trusted brand more.
- Keep the logo small. 42% of employees prefer a subtle logo and 17% want a large one. Embroidered logos stay small and clean.
- Offer choice. 58% of employees want to pick. Set up an Online Store with a short list, or use our group order feature so each person chooses a size.
- Ask employees what they want. A three-question pulse after the holidays closes the Thoughtfulness Gap. Ask what they used, what they didn’t, and what they wish they had received.
- Order by mid-November. Standard delivery takes about two weeks, and the delivery options page shows rush timing.
How We Help the Office Octopus
If you are the one balancing all eight arms of employee gifting season, we are here to take a massive load off your plate.
You don’t have to tackle the entire operation solo. Our Inkers can help with product selection, design, and order support, so the project doesn’t live on your desk alone.
And our product catalog boasts over 15,000 options. Many products have no minimums, bulk discounts kick in as your quantity grows, and our featured brands cover the names employees want most.
When you can’t know 500 people individually, an Online Store hands each person the choice. Our Design Lab shows your design on the product before you order, so you can make sure the design is one your team will recognize as distinctly theirs.That detail is the proof the thought was real.
You are doing important work, and we want it to feel lighter this year.
For more gift ideas, read our guide to employee gifts and swag, our holiday gift guide for corporate clients, and our 2025 survey on gifts to skip.
Appendix: 2026 Holiday Gift Survey Data
The 2026 Holiday Gift Survey is a Custom Ink proprietary survey with two parts. The buyer survey reached 509 employed adults (18 and older) who helped decide on company or organization holiday gifts in the past 12 months. It was fielded September 30 to October 7, 2026, at companies with 11 or more employees. The employee survey reached 502 employed adults (18 and older) at companies with 10 or more employees. It was fielded September 28 to October 2, 2026. Both samples were quality-screened. Percentages use the people who answered each question as the base. Multi-select questions add to more than 100%, and figures are rounded. Open-ended answers were coded to one theme each by keyword matching and spot-checked. Retention and loyalty figures reflect how employees say a gift they like affects them, not measured turnover, and differences between groups are correlations.
Buyer survey (n=509)
Company size (n=509)
| Answer | Share | n |
|---|---|---|
| 11 to 49 | 15% | 75 |
| 50 to 249 | 39% | 199 |
| 250 to 999 | 24% | 123 |
| 1,000+ | 22% | 112 |
Primary role (n=509)
| Answer | Share | n |
|---|---|---|
| Operations / Administration / Procurement | 34% | 171 |
| Human Resources / People Operations | 17% | 87 |
| Sales / Client Success / Business Development | 16% | 79 |
| Executive Leadership (Owner, CEO, President, Founder) | 12% | 62 |
| Other (please specify) | 9% | 47 |
| Finance / Accounting | 8% | 43 |
| Marketing / Brand / Communications | 4% | 20 |
Gifting responsibility in the past 12 months (n=509)
| Answer | Share | n |
|---|---|---|
| I helped decide on holiday gifts my company/organization gives to employees | 80% | 407 |
| I helped decide on holiday gifts my company/organization gives to clients/customers | 57% | 289 |
Kinds of holiday gifts purchased in the past year (n=509)
| Answer | Share | n |
|---|---|---|
| Gift Cards | 63% | 319 |
| Food & Drink (snacks, gourmet, coffee/tea) | 52% | 264 |
| Apparel (shirts, hoodies, hats) | 48% | 245 |
| Drinkware (mugs, water bottles, tumblers) | 45% | 227 |
| Bags (totes, backpacks, duffels) | 36% | 184 |
| Health & Wellness (candles, water bottles, fitness) | 35% | 177 |
| Office Products (notebooks, pens, desk gear) | 31% | 159 |
| Tech / Electronics (chargers, headphones, speakers) | 30% | 155 |
| Stationery (cards, calendars, paper goods) | 28% | 145 |
| Outerwear (jackets, fleece, vests) | 28% | 142 |
| Home & Leisure (blankets, games, kitchenware, entertaining) | 26% | 130 |
| Subscription Gifts (wine, food boxes) | 24% | 124 |
| Kits/bundles (curated multi-item sets) | 22% | 114 |
| Plants or Greenery (succulents, desk plants, or live arrangements) | 18% | 90 |
| Other (please specify) | 1% | 5 |
Typical budget per employee gift (n=407)
| Answer | Share | n |
|---|---|---|
| Under $25 | 14% | 56 |
| $25 – $49 | 43% | 173 |
| $50 – $99 | 31% | 126 |
| $100+ | 13% | 52 |
Typical budget per client gift (n=289)
| Answer | Share | n |
|---|---|---|
| Under $25 | 15% | 43 |
| $25 – $49 | 43% | 124 |
| $50 – $99 | 31% | 90 |
| $100+ | 11% | 32 |
When planning or purchasing begins (n=509)
| Answer | Share | n |
|---|---|---|
| Before September | 11% | 54 |
| September | 17% | 87 |
| October | 32% | 163 |
| November | 27% | 138 |
| December | 11% | 57 |
| We don’t plan in advance / purchase last-minute | 2% | 10 |
Most challenging parts of selecting gifts (up to two) (n=509)
| Answer | Share | n |
|---|---|---|
| Staying within budget | 40% | 204 |
| Finding something that appeals to everyone | 40% | 203 |
| Choosing gifts that feel personal or meaningful | 31% | 159 |
| Making sure gifts are high-quality or useful | 26% | 134 |
| Managing time, planning and purchasing early enough | 15% | 78 |
| Coordinating logistics (ordering, shipping, distribution) | 14% | 71 |
| Getting leadership or stakeholder approval | 12% | 62 |
| Finding eco-friendly or sustainable options | 10% | 49 |
Approach believed to have greater impact (n=509)
| Answer | Share | n |
|---|---|---|
| Giving one high-quality or premium item | 68% | 347 |
| Giving multiple less-expensive gifts | 32% | 162 |
Confidence that gifts are meaningful to recipients (n=509)
| Answer | Share | n |
|---|---|---|
| Very confident | 45% | 231 |
| Somewhat confident | 48% | 242 |
| Not very confident | 6% | 28 |
| Not at all confident | 1% | 4 |
| We don’t really think about this | 1% | 4 |
How the company decides what to give (n=509)
| Answer | Share | n |
|---|---|---|
| We have real insight into what recipients want or would value | 35% | 179 |
| Someone on the team makes a personal judgment call | 22% | 110 |
| We mostly go with what’s within budget and hope it lands well | 20% | 104 |
| We follow what we did last year without much reconsideration | 13% | 67 |
| We rely on a vendor’s recommendation | 9% | 44 |
| Other (please specify) | 1% | 5 |
What would most increase confidence (up to two) (n=509)
| Answer | Share | n |
|---|---|---|
| A wider range of quality options within budget | 39% | 199 |
| Feedback from past gift recipients | 38% | 193 |
| Ability to personalize without added cost or complexity | 35% | 180 |
| Data or research on what recipients actually want or keep | 27% | 136 |
| Expert guidance on product selection | 22% | 113 |
| Nothing, we’re already confident | 5% | 27 |
Primary goal for employee gifts (n=407)
| Answer | Share | n |
|---|---|---|
| Showing appreciation | 42% | 170 |
| Boosting morale and engagement | 19% | 76 |
| Motivating performance | 16% | 67 |
| Strengthening company culture or connection | 15% | 60 |
| Supporting retention efforts | 8% | 32 |
| Other (please specify) | 0% | 2 |
How employee gift success is measured (n=407)
| Answer | Share | n |
|---|---|---|
| Employee feedback or thank-you notes | 51% | 207 |
| Participation in company events or programs | 32% | 132 |
| Internal engagement or satisfaction surveys | 32% | 129 |
| Employee retention or tenure metrics | 27% | 110 |
| We don’t currently measure employee gifting success | 25% | 102 |
| Social media or internal sharing (photos, posts, mentions) | 23% | 92 |
| Other (please specify) | 0% | 1 |
Primary goal for client gifts (n=289)
| Answer | Share | n |
|---|---|---|
| Showing appreciation or gratitude | 32% | 93 |
| Strengthening client or customer relationships | 28% | 82 |
| Increasing brand visibility or goodwill | 16% | 46 |
| Retaining or renewing business | 14% | 41 |
| Accelerating deals or influencing decisions | 9% | 27 |
How gifts are sourced (n=509)
| Answer | Share | n |
|---|---|---|
| Through multiple vendors depending on the occasion | 35% | 180 |
| Managed entirely in-house | 27% | 135 |
| Through an online gifting platform or marketplace | 20% | 100 |
| Through a single primary vendor or partner | 18% | 93 |
| Other (please specify) | 0% | 1 |
Employee gifts: same gift or options (n=407)
| Answer | Share | n |
|---|---|---|
| We typically give the same gift to all recipients | 47% | 190 |
| We usually provide a few options for each recipient to choose from | 53% | 217 |
Client gifts: same gift or options (n=289)
| Answer | Share | n |
|---|---|---|
| We typically give the same gift to all recipients | 45% | 129 |
| We usually provide a few options for each recipient to choose from | 55% | 160 |
| Criterion when choosing holiday gifts | Rated very or extremely important |
|---|---|
| Quality | 80% |
| Price and value | 74% |
| Usefulness | 74% |
| Fast delivery | 65% |
| Personalization | 58% |
| Branding or logo | 55% |
| Eco-friendliness or sustainability | 47% |
| Trendiness | 45% |
Employee survey (n=502)
Company size (n=502)
| Answer | Share | n |
|---|---|---|
| 11 to 49 | 24% | 118 |
| 50 to 249 | 32% | 159 |
| 250 to 999 | 20% | 99 |
| 1,000+ | 25% | 126 |
Age range (n=502)
| Answer | Share | n |
|---|---|---|
| 18-24 | 13% | 64 |
| 25-34 | 19% | 93 |
| 35-44 | 18% | 89 |
| 45-54 | 19% | 95 |
| 55-64 | 17% | 84 |
| 65-99 | 15% | 77 |
Expect an employer gift this year (n=502)
| Answer | Share | n |
|---|---|---|
| Yes | 52% | 262 |
| Maybe | 25% | 128 |
| No | 16% | 80 |
| Not sure / don’t know | 6% | 32 |
Received an employer gift last holiday season (n=502)
| Answer | Share | n |
|---|---|---|
| Yes | 78% | 394 |
| No | 22% | 108 |
Gift types that feel newest or hottest (up to three) (n=502)
| Answer | Share | n |
|---|---|---|
| New technology or devices (e.g., headphones, speakers, smart-home devices, etc.) | 51% | 254 |
| Food & beverage gifts (e.g., gourmet snacks, specialty coffee, etc.) | 38% | 191 |
| Wellness or self-care items (e.g., skincare, relaxation products, etc.) | 34% | 172 |
| Premium or brand-name apparel | 27% | 136 |
| Fitness or recovery tech (e.g., wearables, massagers, smart bottles, etc.) | 26% | 131 |
| Travel or outdoor lifestyle items (e.g., weekender bags, travel kits, sunglasses, etc.) | 23% | 117 |
| Curated or themed gift kits / boxes | 22% | 109 |
| Premium or brand-name drinkware | 17% | 83 |
| Sustainable or eco-friendly products | 14% | 71 |
| Other (please specify) | 4% | 22 |
Preferred timing for receiving a gift (n=502)
| Answer | Share | n |
|---|---|---|
| Early November | 5% | 26 |
| Mid-to-late November | 9% | 43 |
| Early December | 31% | 157 |
| Mid-December | 26% | 130 |
| Right before the holiday break | 24% | 118 |
| After the new year | 1% | 6 |
| Timing doesn’t matter to me | 4% | 22 |
Brands employees would like to receive (n=502)
| Answer | Share | n |
|---|---|---|
| Nike | 51% | 257 |
| North Face | 44% | 222 |
| Sony | 42% | 211 |
| Adidas | 41% | 205 |
| Yeti | 39% | 196 |
| Bose | 39% | 196 |
| Stanley | 38% | 192 |
| Under Armour | 37% | 188 |
| JBL | 33% | 167 |
| Carhartt | 31% | 156 |
| Otterbox | 23% | 117 |
| Patagonia | 23% | 116 |
| Coleman | 18% | 92 |
| Nutribullet | 16% | 81 |
| Owala | 12% | 60 |
| Koozie | 9% | 46 |
| Anker | 8% | 39 |
| Marmot | 7% | 36 |
| Moleskine | 7% | 34 |
| Tumi | 7% | 34 |
| Outdoor Research | 5% | 25 |
| Thule | 4% | 21 |
| OGIO | 4% | 20 |
| Other (please specify) | 4% | 18 |
| Cotopaxi | 3% | 14 |
Value of a gift from a trusted or premium brand (n=502)
| Answer | Share | n |
|---|---|---|
| I value it much more | 52% | 261 |
| I value it somewhat more | 43% | 217 |
| I value it somewhat less | 3% | 16 |
| I value it much less | 2% | 8 |
Value of a gift that feels personal (n=502)
| Answer | Share | n |
|---|---|---|
| I value it much more | 64% | 320 |
| I value it somewhat more | 30% | 153 |
| I value it somewhat less | 4% | 20 |
| I value it much less | 2% | 9 |
Logo size and placement (n=502)
| Answer | Share | n |
|---|---|---|
| I prefer gifts with a logo or branding that is small and subtle | 42% | 212 |
| I don’t care about the logo size or placement on gifts | 41% | 206 |
| I prefer gifts with a logo or branding that is large and prominent | 17% | 84 |
Same gift for everyone or choice of options (n=502)
| Answer | Share | n |
|---|---|---|
| Prefer to choose from several options | 58% | 290 |
| Prefer the same gift for everyone | 23% | 117 |
| No preference | 19% | 95 |
One premium item or several cheaper items (n=502)
| Answer | Share | n |
|---|---|---|
| Prefer one high-quality or premium item | 55% | 277 |
| Prefer multiple less-expensive items | 22% | 110 |
| No preference | 23% | 115 |
Effect of a liked gift on feelings about the employer (n=502)
| Answer | Share | n |
|---|---|---|
| Makes me feel much more positive about my employer | 60% | 302 |
| Makes me feel somewhat more positive about my employer | 37% | 188 |
| Makes me feel somewhat less positive about my employer | 2% | 8 |
| Makes me feel much less positive about my employer | 1% | 4 |
Effect of a liked gift on likelihood to stay (n=499)
| Answer | Share | n |
|---|---|---|
| Much more likely to stay | 48% | 238 |
| Somewhat more likely to stay | 50% | 248 |
| Somewhat less likely to stay | 2% | 12 |
| Much less likely to stay | 0% | 1 |
Top-3 favorite gift categories (n=486)
| Answer | Share | n |
|---|---|---|
| Gift Cards | 55% | 267 |
| Tech / Electronics (chargers, headphones, speakers) | 38% | 185 |
| Apparel (shirts, hoodies, hats) | 31% | 152 |
| Food & Drink (snacks, gourmet, coffee/tea) | 30% | 146 |
| Outerwear (jackets, fleece, vests) | 24% | 116 |
| Home & Leisure (blankets, games, kitchenware, entertaining) | 20% | 96 |
| Drinkware (mugs, water bottles, tumblers) | 18% | 88 |
| Bags (totes, backpacks, duffels) | 17% | 85 |
| Health & Wellness (candles, water bottles, fitness) | 17% | 83 |
| Subscription Gifts (wine, food boxes) | 16% | 76 |
| Kits/bundles (curated multi-item sets) | 9% | 46 |
| Plants or Greenery (succulents, desk plants, or live arrangements) | 9% | 46 |
| Stationery (cards, calendars, paper goods) | 8% | 38 |
| Office Products (notebooks, pens, desk gear) | 5% | 24 |
| Other (please specify) | 2% | 10 |
Top-3 least favorite gift categories (n=486)
| Answer | Share | n |
|---|---|---|
| Office Products (notebooks, pens, desk gear) | 51% | 249 |
| Stationery (cards, calendars, paper goods) | 43% | 207 |
| Plants or Greenery (succulents, desk plants, or live arrangements) | 37% | 178 |
| Subscription Gifts (wine, food boxes) | 23% | 112 |
| Drinkware (mugs, water bottles, tumblers) | 20% | 97 |
| Health & Wellness (candles, water bottles, fitness) | 19% | 90 |
| Bags (totes, backpacks, duffels) | 18% | 89 |
| Food & Drink (snacks, gourmet, coffee/tea) | 16% | 80 |
| Kits/bundles (curated multi-item sets) | 14% | 69 |
| Home & Leisure (blankets, games, kitchenware, entertaining) | 13% | 62 |
| Apparel (shirts, hoodies, hats) | 12% | 60 |
| Gift Cards | 12% | 58 |
| Tech / Electronics (chargers, headphones, speakers) | 11% | 52 |
| Outerwear (jackets, fleece, vests) | 10% | 47 |
| Other (please specify) | 2% | 8 |
How employees feel about most gifts received (n=486)
| Answer | Share | n |
|---|---|---|
| Both, genuinely cool AND useful | 35% | 170 |
| Useful and practical, even if not particularly exciting | 38% | 183 |
| Cool or interesting, but not something I actually use | 21% | 101 |
| Neither, most gifts I’ve received are unmemorable and unused | 7% | 32 |
What makes employees keep a gift (up to two) (n=486)
| Answer | Share | n |
|---|---|---|
| It’s genuinely useful in daily life | 51% | 248 |
| It’s high quality and durable | 43% | 211 |
| It fits my personal style or taste | 35% | 168 |
| It has personal meaning attached (a message, the occasion, who gave it) | 27% | 130 |
| It’s from a brand I already like | 22% | 106 |
| Nothing in particular, I keep most gifts either way | 6% | 29 |
What employees did with the most recent gift in each category
| Category | n | Used regularly | Kept, rarely used | Given away | Thrown away |
|---|---|---|---|---|---|
| Tech / electronics | 296 | 53% | 24% | 12% | 6% |
| Drinkware | 368 | 44% | 32% | 13% | 7% |
| Apparel | 369 | 43% | 36% | 13% | 6% |
| Outerwear | 317 | 43% | 34% | 13% | 5% |
| Home and leisure | 295 | 40% | 32% | 13% | 6% |
| Health and wellness | 315 | 38% | 28% | 18% | 9% |
| Bags | 328 | 38% | 31% | 20% | 5% |
| Plants or greenery | 217 | 35% | 27% | 19% | 11% |
| Office products | 320 | 32% | 35% | 16% | 8% |
| Stationery | 320 | 30% | 29% | 19% | 14% |
Best holiday gift ever received from an employer (coded themes) (n=501)
| Theme | Share | n |
|---|---|---|
| Gift cards | 30% | 149 |
| Cash, bonus or extra pay | 28% | 139 |
| Tech & electronics | 11% | 53 |
| Home & personal items | 10% | 51 |
| Food, drink & holiday meals | 5% | 27 |
| Apparel & bags | 4% | 20 |
| Watches & jewelry | 3% | 16 |
| Time off, trips & experiences | 3% | 16 |
| Nothing memorable / never received | 1% | 7 |
| Big-ticket surprises (car, ATV, pets) | 1% | 6 |
Worst holiday gift ever received from an employer (coded themes) (n=469)
| Theme | Share | n |
|---|---|---|
| Nothing / no gift | 23% | 106 |
| Cheap, generic or branded items | 22% | 102 |
| Food, candy & fruitcake | 12% | 58 |
| Socks & clothing | 10% | 45 |
| Gift cards or token cash | 8% | 38 |
| Just a card, thank-you or hug | 6% | 27 |
| No bad gifts / grateful for anything | 4% | 19 |
| Flowers, plants, candles & toiletries | 4% | 17 |
| Events or perks that missed | 2% | 11 |
| Can’t recall | 1% | 7 |
| Joke answers (coal, etc.) | 1% | 5 |
What aspect of personalization matters most (coded themes) (n=465)
| Theme | Share | n |
|---|---|---|
| Shows thought, time & effort | 38% | 177 |
| My name, initials or engraving | 12% | 56 |
| Fits my interests, taste & needs | 11% | 51 |
| Feels made just for me | 11% | 51 |
| Feeling seen, valued & appreciated | 5% | 24 |
| Everything / all of it | 3% | 15 |
| Not sure / doesn’t matter | 3% | 14 |
| Quality | 2% | 10 |
Frequently Asked Questions
Q: What is the best gift for employees?
Whether you are picking employee Christmas gifts or end-of-year thank-yous, employees keep gifts that are useful, well made, and personal. In our survey, tech is the most-used category at 53% regular use, and gift cards are the top favorite at 55%. Apparel and outerwear are both in regular use for 43% of employees who received them. Browse our custom employee gifts to see tumblers, hoodies, jackets, and tech with your logo.
Q: Are gift cards a good holiday gift for employees?
Yes, if the amount is meaningful. Gift cards are the top favorite category at 55%, and they make up 30% of best-gift answers. Token amounts backfire, though, and small cards show up among the worst-gift answers. Gift cards also count as taxable income for employees, as the next answer explains.
Q: Are holiday gifts for employees taxable?
Gift cards and other cash equivalents are always taxable income to employees, no matter how small. The IRS says they are “never excludable as a de minimis benefit” in Publication 15-B. Holiday gifts other than cash, with a low fair market value, can qualify as de minimis benefits. We are not tax advisors, so check your situation with an accountant.
Q: How much should a company spend on employee holiday gifts?
In our survey, 43% of buyers spend $25 to $49 per employee, 31% spend $50 to $99, 14% spend under $25, and 13% spend $100 or more. Employees prefer one premium item (55%) over several cheaper ones (22%). A single better gift usually beats two cheaper ones.
Q: When should you order employee holiday gifts?
Order by mid-November for early December arrival. Most employees (81%) want their gift between early December and the holiday break. Our standard delivery takes about two weeks with free shipping, and rush options cost extra.
Q: Should employee holiday gifts have a logo?
Keep it small. Among employees, 42% prefer a subtle logo, 41% do not care, and 17% want a large one. Embroidery gives a clean, small logo on jackets, fleece, and hats.
Q: How do you make an employee gift feel personal?
Show effort. Nearly every employee (94%) values a personal gift more, and 38% say personal means thought, time, and effort. Only 12% point to a name or initials. Start with a gift chosen for the person, then add a name with our Design Lab.
Q: Do holiday gifts for employees help with retention?
Employees say they do. In our 2026 survey, 97% of employees say a holiday gift they really like makes them more likely to stay. Another 98% say it makes them feel more positive about their employer. Employees who got a gift last season were more likely to say “much more likely to stay” (52% vs. 31%). Only 8% of buyers name retention as their primary goal for employee gifts.

The Custom Ink Staff is a team of design enthusiasts and promo product experts dedicated to bringing your ideas to life. From screen printing secrets to the latest trends in custom gear, we draw on decades of collective experience to help you create something unforgettable.